Data in community development are facts about the conditions of neighborhoods or communities and the people who live in them. Data, for example, may be the number of mothers in the community who suffer from depression, days of school missed by children in a housing complex, proximity to transportation, number of reported crimes in an area, or health insurance status of the residents.
If data are the units, measurement is the process of collecting that information and making it understandable. This can be to determine a “baseline” (i.e. where are we now?), discern change over time, determine impact resulting from a new program, or make decisions about what investment to make next.
When combined and given a context, community development data become information that can be compared, sorted, and analyzed to answer important questions related to health and well-being. Has the number of adults with Type 2 diabetes been rising? Is there a shortage of full-service supermarkets? Is there a connection between the two? Measurement of community development data can also ask whether there are positive impacts on facets of the neighborhood or aspects of people’s lives that are not traditionally considered, e.g. reduced emergency room visits, better school performance, or improved walkability.
Answers to questions like these can help organizations better design or change programs, provide information to engage new partners, and identify a return on investment that has value to another sector. The shared goal of data collection and measurement is to improve both community conditions and people’s lives.
There are five main sources (and types) of data:
Data from traffic sensors that every 20 seconds capture cars passing at hundreds of locations around a region is an example. An advantage of big data is that it is often available more quickly than surveys or other sources since it’s collected in “real time.” For example, Open Data portals launched by several city governments (e.g., San Francisco) share real-time data about city services.
Every approach to a problem needs a compelling logic behind it. Logic models are a roadmap to thinking through a problem—how to get from A to Z, the path from intervention to impact.
Logic models can provide a way to see and agree on the interventions and outcomes, and the pathway between the two. Logic models also help you talk through assumptions about your work’s impact. Logic models can also help correct the course if something goes wrong. Leaders can backtrack, reassess the assumptions in the model, and make mid-course corrections.
See the Metrics for Healthy Communities for an example.
To better target resources.
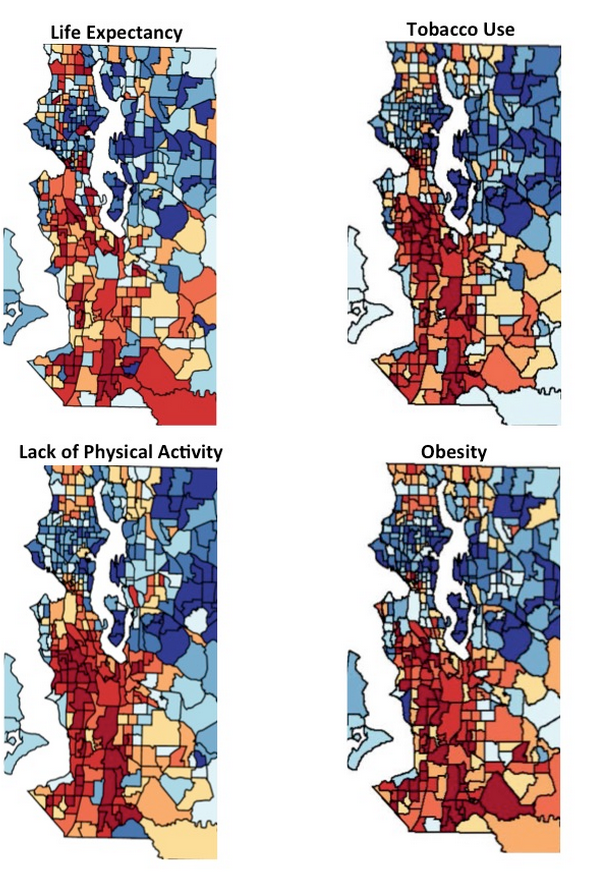
A collaborative of public health professionals, elected officials, and activists created a series of “heat maps” using highly localized data on the health and well-being of residents in King County, Washington. Hanging the maps on the wall, the group uttered a collective gasp. The same neighborhoods were red regardless of the indicator (and without a doubt indicators tied to community development work like poverty rate, poor quality housing, or lack of community infrastructure and services would have appeared the same).
The maps helped community organizations hone in on the areas with the highest need, and it helped the major funders understand where to direct their resources for greater impact. Grants were usually distributed evenly throughout the area, said Kirsten Wysen, Communities of Opportunity Project Manager, but “the maps woke us up and we realized we need to deliberately and intentionally invest in a small number of places – those with the fewest resources.”
To better engage community members.
Data and measurement can help even the playing field between “experts” and communities. “Community residents often feel mistreated, disrespected, and distrustful of outsiders,” Ana Marie Argilagos told “Moving to Higher Ground.” Measuring and interpreting hard data – and bringing that information to residents – can provide an opportunity to reflect on the findings and engage them in the issues at hand.
To bolster anecdotal evidence.
One-off stories can be great and compelling. But to truly make a case to the full spectrum of interested parties, we need facts and evidence.
In Oakland, California, a child care center now has proof that its efforts are working. At the Booth Memorial Child Development Center in Oakland, funding from the Low Income Investment Fund (LIIF), helped replace old, dirty carpeting, put in new child-level sinks, and update the outdoor play space. Immediately, the teachers felt much healthier with reduced asthma symptoms, but could they prove the investment was having an impact? Data collected by LIIF confirmed their hunches – and more. Attendance was up among students who no longer had frequent asthma attacks and staff disability claims for lower back injuries from hoisting up the children for hand washing dropped dramatically, both improving the bottom line for the Center. And parents and teachers reported feeling more comfortable about the safety of the play area. Those findings now serve as evidence to support and increase LIIF’s investments in healthy childcare in other cities.
To help make mid-course corrections.
In Minneapolis, city staffers spotted an aberration in the frequency of 311 calls and redirected resources to address it. After mapping all the “nuisance” complaints coming in from across the city, staff realized one supervisory district had twice the number of complaints as the district with the fewest, but the same number of support personnel. As a result, they reallocated staff and resources to the higher-need district, saved money, and improved call responsiveness.
Documenting disparities and strengths can give community members the ammunition to demand change.
In San Diego, the predominantly Latino Old Town neighborhood had been rezoned to include light industrial among the residential neighborhood. As machine shops and car detailing shops sprung up, air quality declined, and particulates in the air increased. The particulates would stick to clothing and be carried into the homes, putting children at risk for asthma and other respiratory ailments.
A research team trained local women as health workers to go door-to-door and measure air quality in the homes. Coupling this information with GIS mapping data of toxic sites, the women took their case to City Hall, and the neighborhood was eventually rezoned for residential. One of the women would go on to become the vice-mayor of National City, CA.
No. Measurement can point to solutions, not just problems. In Jacksonville, Florida, community members track quality of life indicators. When trends are moving in the wrong direction, like rising crime rates, they devote resources to the problem. Areas showing improvement, on the other hand, become motivators and reminders that action can lead to change. Without measures of progress, it would be impossible to know which areas are succeeding and can serve as models for others and which areas need additional resources.
The San Pablo Avenue Revitalization Collaborative (SPARC), and the East Bay Asian Local Development Corporation (EBALDC) in Oakland, CA, knew the community was facing a range of issues, from crime to health disparities. Data helped focus their efforts.
Using county health department data, demographic information, and city planning reports, SPARC presented maps and infographics of the data. The results helped the community zero in on health and wellness as the starting point.
Although the community stressed the many interlocking conditions that contribute to the community’s overall health, they also understood the importance of selecting concrete metrics that would enable SPARC to define activities, track progress, and correct the course as needed.
The group continues to take an “adaptive practices” approach, an iterative process in which the group takes action based on current knowledge, assesses the results, and uses that information to guide the next action.
Community members are critical to research efforts. Not only can they “ground-truth” plans (ensure that the plans match the reality in the neighborhood), but they can also decide what health concerns they want addressed. Community members can also help collect data and determine what to measure and why.
Workers in San Francisco’s Chinatown helped researchers and public health officials refine surveys on working conditions to ensure that the research team was asking the right questions and to avoid miscommunication in the questions. Several community members also spent hours surveying their fellow workers.
The result was a much more robust survey—and a $4.5 million settlement for back pay plus new policies like fully paid health care. The Department of Public Health now also regularly considers worker health and safety in their work across the city. Without the Chinese community guiding and executing the study, the survey would likely have missed just how deep the problems ran.
When different organizations align measures across projects, it helps solidify action.
“When stakeholders first came together to define common measures of homelessness,” writes Fay Hanleybrown and colleagues in their seminal article on collective impact, “they were shocked to discover that the many agencies, providers, and funders were using thousands of separate measures relating to homelessness. …Merely developing a limited set of eight common measures with clear definitions led to improved services and increased coordination.”
The Vita Health & Wellness District is a previously blighted Connecticut neighborhood where residents now feel safe walking around, enjoy access to a health center, and take cooking classes at the local urban farm. The dynamic environment is the product of a concerted collaboration between a hospital, a housing authority, and a handful of community partners with different interests. Such deep cooperation between sectors isn’t organic for anyone, but it’s made easier and rewarding with the help of the Vita Impact Grid, which uses an asset-mapping diagram to identify resources and funding opportunities, as well as potential partnerships. Using the grid as a project management tool maintains the focus and long-term commitment of collaborative partners and, potentially, funders.
In Curry County, Oregon, one in three families lives in manufactured homes. But many of those homes were built in the 1970s and are becoming dilapidated and dangerous to health. A public health and community development project used a health impact assessment (HIA) to spark change. The results led to a new lending program for homeowners and to design changes in the homes.
For the Manufacture Housing Association of Oregon, said Annette Klinefleter, the project’s HIA author, “the HIA was an extraordinarily powerful tool because it truly influenced their design standards.” They hadn’t thought about design through the lens of health before.
“When a project has a clear base in public health evidence,” said Andrea Hamberg of the Oregon Health Authority, “it changes how people think about the work they do, it changes what is possible in terms of fundraising, and it changes how policymakers make decisions.”
Here are some steps to get you started:
Start-up Resources
The “Practical Playbook” by Duke University Medical School is a helpful tool to help choose and use metrics.
The “Metrics for Healthy Communities” can also help you plan an evaluation and find the data sources to help measure change.
Explore the MeasureUP site for more resources and examples of measuring impact.