
Enterprise Community Partners in partnership with Success Measures developed the Healthy Housing Outcomes Survey to enable its users to measure changes in resident health outcomes most likely to be influenced by healthy housing development.
The St. Louis Federal Reserve’s Community Development department launched this interactive tool that aggregates investments into low and moderate income communities.

The City Health Dashboard is made up of 37 measures of health, the factors that shape health, and drivers of health equity to guide local solutions for 500 U.S. cities.
1
Stewards of Affordable Housing for the Future‘s new Toolkit for Resident Centered Outcomes Measurement in Affordable Rental Housing helps affordable housing providers measure resident outcomes while centering equity and residents. Shared language and improved practices can help housing providers and their partners identify what works and build partnerships, policies, and investments to scale it.
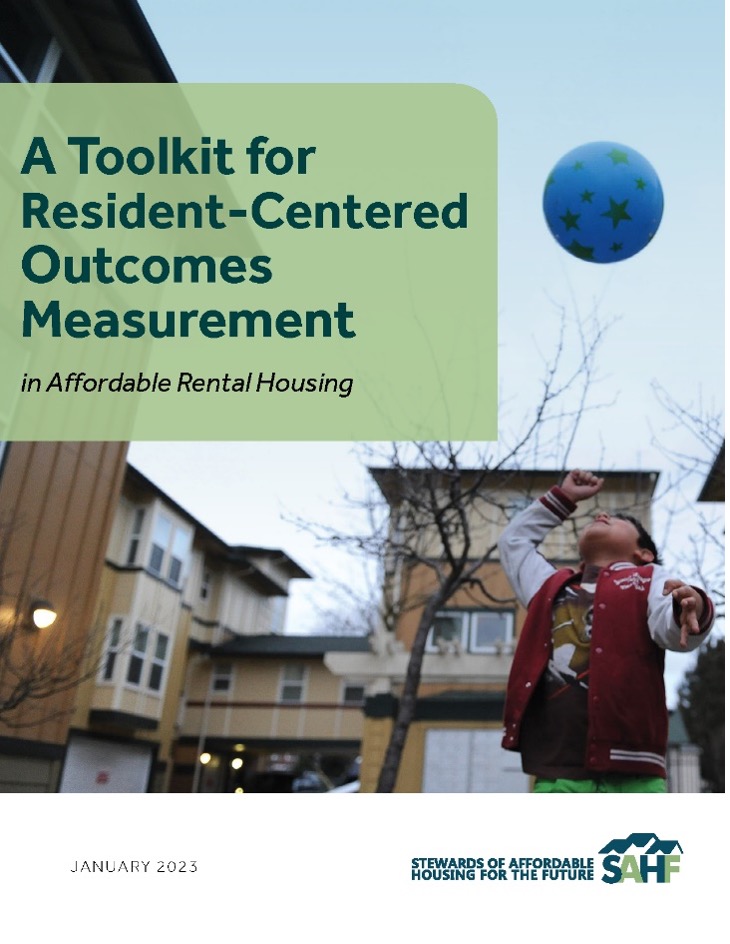
With the support of the Amazon Housing Equity Fund, Stewards of Affordable Housing for the Future has created a new toolkit bringing together over a decade of work around resident outcomes, providing guidance to affordable housing owners, operators, funders, and partners on approaches to services that are outcomes-driven, equitable, and resident-centered. This toolkit may be particularly useful to housing and services providers seeking to scale or refine their services programs, housing providers seeking to add or better integrate outcomes measurement with services, or funders of housing and services.
2
Corporation for Supportive Housing (CSH) developed the Racial Disparities and Disproportionality Index as part of their collection of tools designed to guide those in service of achieving more equitable outcomes for those most impacted and disproportionately represented across crisis systems.
CSH’s Racial Disparities and Disproportionality Index (“RDDI”) looks at 16 unique systems and measures whether a racial and/or ethnic group’s representation in a particular public system is proportionate to, over or below their representation in the overall population (proportionality) and allows for the examination of systematic differences between groups and geographies (disparities). The RDDI provides a standardized comparison between groups.
Check out RDDI’s Overview and Guide on how to use the tool.
3
The HOPE Initiative provides an interactive data tool designed to help states and the country move beyond measuring disparities to spurring action toward health equity.
The Hope Initiative is funded by the Robert Wood Johnson Foundation (RWJF) and is led by the National Collaborative for Health Equity and Texas Health Institute in partnership with Virginia Commonwealth University’s Center on Society and Health. HOPE sets benchmarks and tracks 27 indicators by race, ethnicity, and socioeconomic status for the nation, all 50 states, and D.C. The indicators measure Social and Economic Factors, Community & Safety, Physical Environment, Access to Healthcare, and Health Outcomes, demonstrating how well D.C., each state, and the country are doing to provide equitable opportunities for communities to thrive and achieve good health.
4
Enterprise Community Partners in partnership with Success Measures developed the Healthy Housing Outcomes Survey to enable its users to measure changes in resident health outcomes most likely to be influenced by healthy housing development.
The survey was developed as a supporting resource for Enterprise’s Green Communities Criteria and its Health Action Plan framework; however, it has broader application for the field. The survey assesses the benefits of healthy affordable housing itself, rather than a specific intervention. This focus allows community development corporations and affordable housing stakeholders to utilize a standard tool across housing portfolios, even when specific health-promoting strategies vary from property to property.
The final survey, available in English and Spanish, is 47 questions, takes 10-20 minutes to complete, covers 8 domains (resident satisfaction; health status; eating habits; physical activity; respiratory health; children’s health status; building maintenance; and social connections), and includes demographic questions for analysis purposes. The survey can be used as a point-in-time measurement of resident health related to housing but will be more impactful if administered annually to assess trends in the health and well-being of residents over time. Used as a feedback loop, the survey results may identify the need to maintain, alter or add a health-enhancing intervention.
Individual survey questions were drawn from the Success Measures Health Measurement Outcome Tools which were specifically designed to measure the health outcomes of housing and community development programs, as well as the literature base. Our Healthy Housing Outcomes Survey was field tested through two focus groups of affordable housing residents.
Contact Enterprise Community Partners for more information.
5
The St. Louis Federal Reserve’s Community Development department launched the Community Investment Explorer (CIE), an interactive tool that aggregates investments into low and moderate income communities.
The investments support a range of activities, from affordable housing to commercial real estate development, consumer and business lending, and more. Collectively, these programs are responsible for several billion dollars of investment into LMI communities each year.
The CIE draws on publicly available data from over 500,000 investment transactions through:
Sort the data by geographic region (MSA, Non-MSA, or state), year, purpose and type of construction.
Learn more about the data used in the CIE here.
6
The City Health Dashboard is made up of 37 measures of health, the factors that shape health, and drivers of health equity to guide local solutions for 500 U.S. cities.

Explore and compare metrics within your city. Data on measures such as diabetes, smoking, walkability, and housing costs all paint a picture of health, within the city and neighborhood-by-neighborhood. You can use the Dashboard to compare metrics within your city to find correlation between these health factors. Read the Expert Insight on our blog to dive deeper.
Dig deeper into what’s contributing to health and opportunity gaps within 500 U.S. cities. Opportunities for health and well-being are not the same across cities. In fact, even neighborhoods right next to each other can provide drastically different opportunities for health and well-being. The Dashboard can help you dig deeper into your city’s data at the city, neighborhood, and demographic level to identify challenges in your community and target actions to address them.
Compare with peer cities. You can use the City Health Dashboard’s unique “compare cities feature” to find your city’s peer cities, or those of similar size or with similar characteristics, and compare them. By comparing your city to peers across the country, the Dashboard can help you learn from them and set realistic goals to address similar challenges.
Take action with evidence-based programs and policies. Every city is unique and will develop its own roadmap toward better health. Once you’ve used the data to identify your community’s health challenges, the Dashboard can help you create a roadmap for your community as you explore examples of evidence-based programs and policies.
Not sure where to start? Watch the launch webinar that provides a tour of the Dashboard.
7
The Rippel Foundation’s ReThink Health developed a Primer for Changemakers to help regional leaders think through key questions around investment of long-term health reform.
Smarter investments backed by sustainable financing can drive profound health reform in regions across the country. This Financing Primer focuses on what sustainable financing is, why it is important, the critical elements of a financing plan, and what others around the country have been doing to frame and finance their work.
The Primer is organized into seven sections centered on the following topics/questions:
8
The 100 Million Healthier Lives Adult Well-Being Assessment is a seven-item questionnaire to measure well-being in four domains: physical health, mental health, social well-being, and spiritual-well being. The assessment tool was created by the 100 Million Healthier Lives Metrics Development team using previously validated items and input from over 30 leading experts from a variety of public, private, and academic institutions.
The vision of 100 Million Healthier Lives (100MLives) is to fundamentally transform the way the world thinks and acts to improve health, well-being, and equity to get to breakthrough results. By choosing an audacious goal of 100 million people living healthier lives by 2020, that no one organization can achieve alone, members and communities in this movement are committing to unprecedented collaboration, a humble spirit of learning, innovation and improvement, and systemic change to create an equitable health and wellbeing system.
To reach this goal, our Measurement Framework includes three key principles of the 100MLives initiative: health and well-being, equity, and sustainability. Drivers of sustainable, equitable well-being occur at three levels: people (subpopulations), places (community), and systems (societal). As part of the Measurement Framework, the Well-Being Assessment was developed as a brief questionnaire, using items from validated instruments for communities to measure individual well-being among adults (18 and older).
In addition, the 100MLives Metrics Development Team has developed a catalog of over 2,000 measures that relate to what a community might be working on to improve health, well-being and equity as part of its Measure What Matters Platform. In this platform, users can create a plan, set aims, identify measures, monitor performance and impact, and share progress towards the shared goal of 100 million people living healthier lives by 2020.
9
Learn how a unique investment approach in Boston assigns a HealthScore rating to potential investment projects, based on a set of neighborhood and project screening criteria.
Healthy Neighborhoods Equity Fund 1 (HNEF 1) is a private equity fund that is fully invested in a portfolio of nine projects in greater Boston, MA for a total of $21.3 million. These investments have resulted in the creation of 586 new mixed-income homes and 139,423 square feet of commercial space.
The fund identifies neighborhoods in the early to middle stages of transformational growth and utilizes private investment to develop workforce housing, neighborhood retail, and commercial space alongside affordable housing and other community resources while also providing attractive risk-adjusted returns for investors. HNEF is a partnership of the Massachusetts Housing Investment Corporation and the Conservation Law Foundation.
The fund’s approach to measuring impact is based on a 2013 Health Impact Assessment. Projects that sought an investment from HNEF 1 were evaluated for impact using a weighted index of neighborhood and project-level metrics. Learn more about the transformative impacts of the fund.
The HealthScore Rating System integrates more than 50 measures of neighborhood demographics, community conditions, health outcomes, and project characteristics. The resulting score (from 0-100) reveals how well the project meets the needs of the neighborhood and captures the opportunity for healthy development. See example: Chelsea Flats
The Massachusetts Housing Investment Corporation and the Conservation Law Foundation also manage the HNEF II fund, a $50 million private equity fund that continues to invest in the building blocks of a health community, including development of mixed-income, mixed-use, transit-oriented real estate projects.
10
The Success Measures Health Outcome Tools are now available to the field as a free resource. The more than 65 new data collection tools help evaluate and document the health-related outcomes of a wide range of affordable housing, neighborhood revitalization, workforce development, supportive service and community engagement programs.
Developed by Success Measures, an evaluation resource group at NeighborWorks America, with an advisory group of community development, public health and health care experts, the tools focus on changes in health status, attitudes, behaviors and beliefs at both the individual and community levels – as well as the quality and cultural sensitivity of health-care providers and practices.
Created to address the key social, economic and environmental factors impacting health, such as housing, neighborhood, stress, financial status and community context, the tools include surveys, interview guides, observation protocols and templates for collecting data. The tools can be used “as-is” or customized to evaluate a range of housing, community development, community benefit and health-related programs.
11
Designed with cross-sector collaboration in mind by the Federal Reserve Bank of Minneapolis and Wilder Research of St. Paul, MN, Metrics for Healthy Communities, is a set of resources—from logic models to data sets—to get you started planning for and measuring the impact of neighborhood investments on community health and well-being.
This resource includes logic models, a directory of tested measurements, and sources for existing data.
12
Demonstrate the value of combining social services with affordable housing using this set of outcome measures developed by Stewards for Affordable Housing for the Future (SAHF).
High-quality, affordable housing provides far more than shelter. In an era of pay-for-performance, gathering information on this impact helps make the case that affordable housing with services helps low-income residents find and sustain viable jobs, gain a solid education, find stable housing, become engaged in the community, and improve their health and wellness.
The set of outcome measures (percent of residents whose income increased, for example) tracks the social impact of SAHF’s rental properties and helps improve services to better meet residents’ needs. Outcome data are collected from resident surveys, property management information, the income recertification process or from national surveys.
The outcomes are currently being tested as part of the Strong Families Fund (SFF) initiative. This 10-year initiative will identify the impact of resident service coordination on resident and property outcomes and aid in identifying new and sustainable funding models to support service coordination in affordable housing properties.
13
This tool, developed by a hospital-community partnership, helps identify program opportunities and service gaps and sharpens the focus on outcomes that will collectively lead to a healthier community.
The Vita Health and Wellness District in Stamford, CT, is a partnership between Charter Oak Communities, the Stamford Hospital, the West Side community, and the city of Stamford. The initiative is working to integrate health and wellness principles into daily living, while strengthening the community and managing positive change in the neighborhood. By mapping outcomes (such as walkability or economic opportunity) to Vita’s primary initiatives (such as public housing revitalization or job development), the Vita Impact Grid:
The grid helps partners describe programs in terms of impact areas and sharpens the focus on outcomes that will collectively lead to a healthier community. In addition, describing individual programs by their impacts highlights opportunities for collaboration across groups and leverages funding resources. Hospitals preparing or managing Community Benefit responsibilities can also use the grid as a strategic planning tool.
14
The Mariposa Healthy Living Toolkit helps guide planning, decisions, and actions to improve the important social determinants of health. The tool promotes cross-sector partnerships, encourages a participatory approach to engaging residents and stakeholders, and helps stakeholders identify the best evidence to inform development decisions.
Developed by the Denver Housing Authority and Mithun, Inc., an architectural firm, the Mariposa Healthy Living Toolkit guides the holistic and sustainable redevelopment of the Mariposa District near downtown Denver.
The toolkit identifies six broad determinants of positive health outcomes for successful community redevelopment: 1) healthy housing; 2) sustainable, safe transportation; 3) environmental stewardship; 4) social cohesion; 5) public infrastructure and 6) healthy economy.
The toolkit provides a 5-step User Guide. But more important, for each of the six determinants the toolkit contains objectives and rationale related to health outcomes, recommended indicators and strategies, and references for additional resources. For example Healthy Housing.
The report provides a completed Report Card Template of all six health determinants categories using details of the Mariposa Project as an example.
A Campaign Checklist Template and guidance on measuring progress are included as well.
16
The Health Impact Project is a national initiative designed to promote the use of health impact assessments (HIAs) as a decision-making tool for policymakers. Visit the site in order to analyze data on HIAs and their impact across the country, read the latest news on HIAs, and learn about upcoming events.
Health impact assessments use a flexible, data-driven approach to identify the health consequences of new policies and develop practical strategies to enhance health benefits and minimize adverse effects.
The interactive map and database provides more than 350 examples of HIAs, including for housing, transportation, planning, education, and more. Sort the database by sector, decision-making level, or type of organization leading the HIA. Also see the Frequently Asked Questions page to learn more about the The Cross-Sector Toolkit for Health, a collection of health impact assessments (HIAs), data sets and indicators, research articles, policy briefs, tools, guides, and other resources.
This short video of an HIA conducted in Curry County, Oregon, shows how it helped to promote healthier housing and alleviate the respiratory illnesses, injuries, and other health problems associated with living in poor quality housing.
17
This tool provides data to rank every U.S. county on factors that influence health, from air pollution to obesity and teen births. The rankings standardize and combine measures from several publicly available, national data sources.
The County Health Rankings & Roadmaps program helps communities identify and implement solutions that make it easier for people to be healthy in their schools, workplaces, and neighborhoods.
Ranking the health of nearly every county in the nation, the County Health Rankings illustrate what we know about what makes people sick or healthy based on a model of health.
The Action Center shows what we can do to create healthier places to live, learn, work, and play. For example, community development is specifically called out and includes a list of key activities including How to Work Together, Choose Effective Policies and Programs, and Act on What’s Important.
Bringing diverse partners together to address complex health issues is complicated work. Among the resources offered are Community Coaches, who provide customized consultation to local communities that are on their way to addressing factors that influence health.
An introductory webinar gets you started.
The Robert Wood Johnson Foundation collaborates with the University of Wisconsin Population Health Institute to bring this program to community leaders across the nation.